Tutorial: PVSRA Candles & Zones for SierraChart
Below you can watch the #short chartbook tutorial video for the PVSRA Candles & Zones for SierraChart post: Created with SierraChart v2677...
Below you can watch the #short chartbook tutorial video for the PVSRA Candles & Zones for SierraChart post: Created with SierraChart v2677...
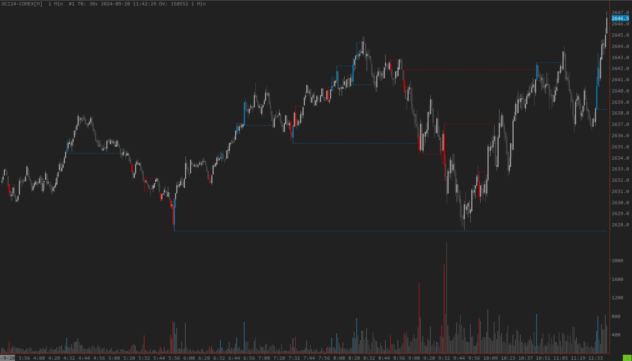
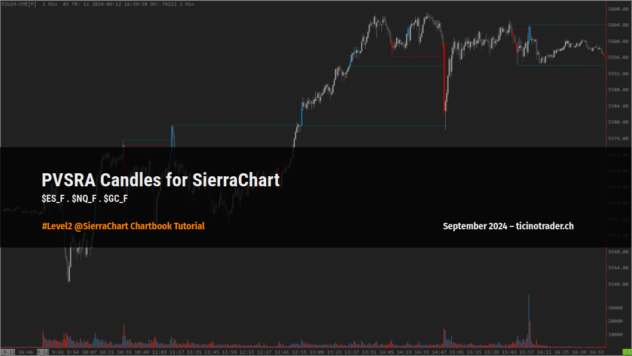
The attached chartbook displays PVSRA (Price/Volume/Support/Resistance) Candles and chart color signals. Blue and Red colored candles and volume bars indicate...
Showcase of the Magnificent 7 Average layout to be used as a replacement of the alternative SierraChart Chartbook here. If...
Below you can watch the #short chartbook tutorial video for the Magnificent 7 Average for SierraChart post: Created with SierraChart v2677 |...
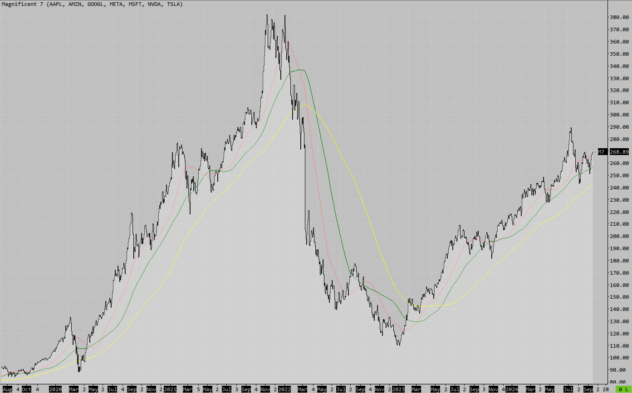
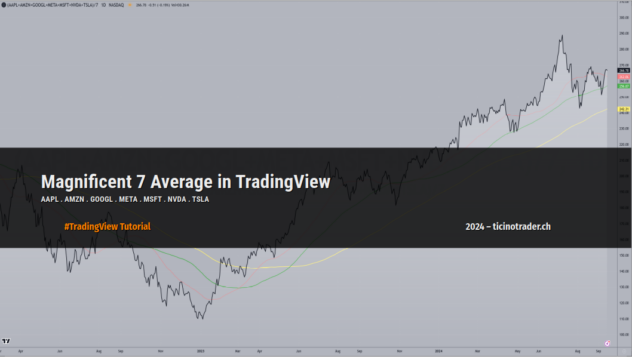
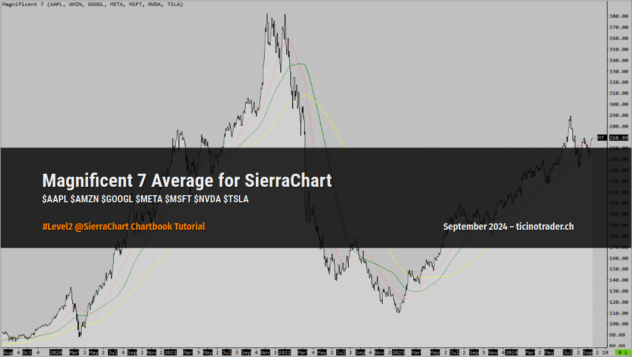
The attached chartbook displays the Magnificent 7 symbol – synthetic average of the major US Stock shares: AAPL, AMZN, GOOGL,...
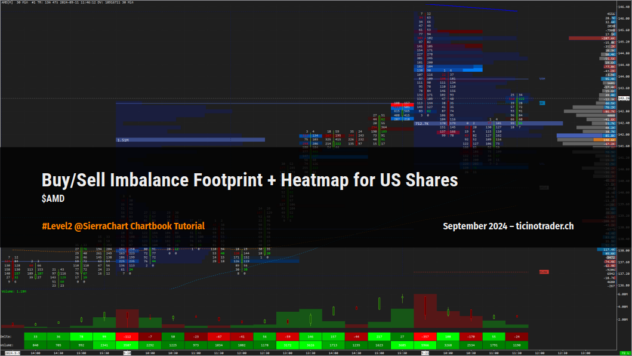
Below you can watch the #short chartbook tutorial video for the Buy/Sell Imbalance Footprint + Heatmap for US Shares post:...
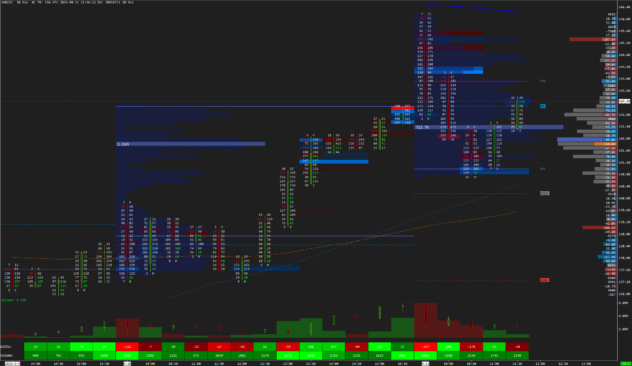
Footprint/Heatmap chartbook created based on a request using the previously posted ATAS ZB template. Features: Daily and 30min based bid/ask...
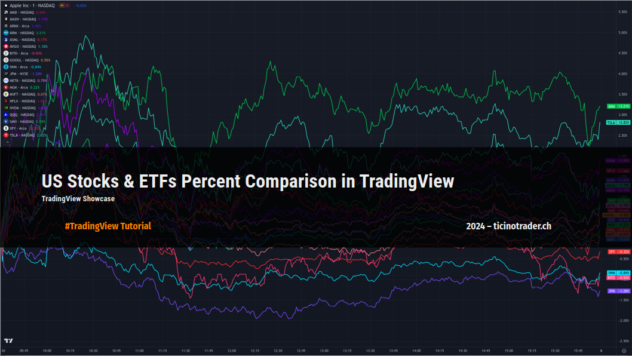
Showcase of the US Stocks & ETFs Percent Comparison layout to be used as a replacement of the alternative SierraChart...
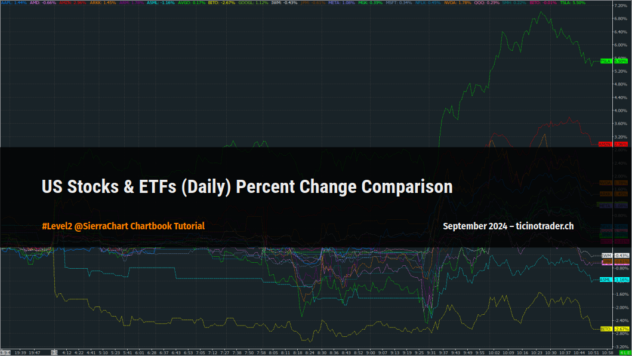
Below you can watch the #short chartbook tutorial video for the US Stocks and ETFs (Daily) Percent Change Comparison post:...
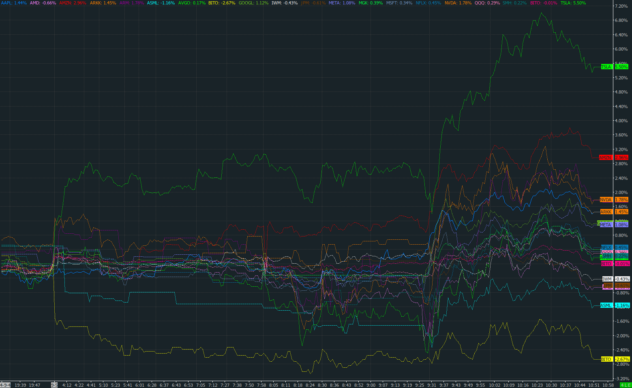
Daily percent change comparison chartbook for US Stocks and ETFs – created based on a request from a Tradingview layout....