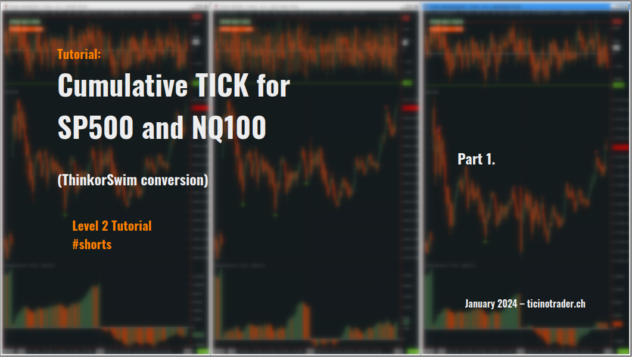
Tutorial: Cumulative TICK for ES and NQ
Below are two #short chartbook tutorial videos for the Cumulative TICK for ES and NQ post. Created with SierraChart v2586 | Link...
Below are two #short chartbook tutorial videos for the Cumulative TICK for ES and NQ post. Created with SierraChart v2586 | Link...
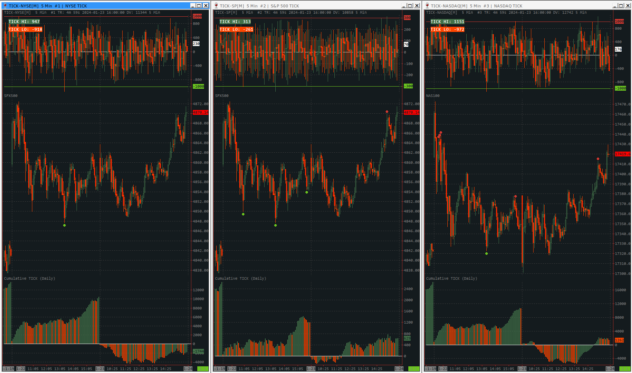
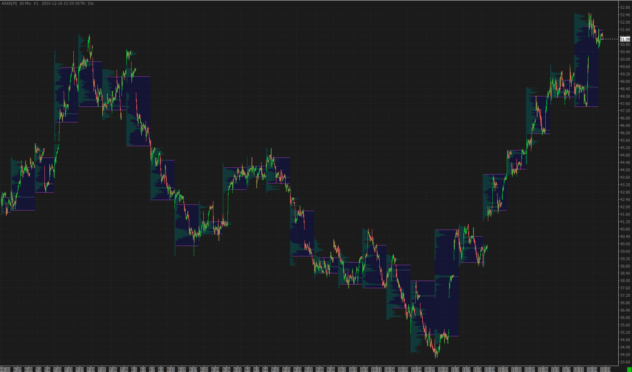
The attached chartbook request displays the Cumulative TICK index for the NYSE, NASDAQ and SP500 The charts display the NQ/ES...
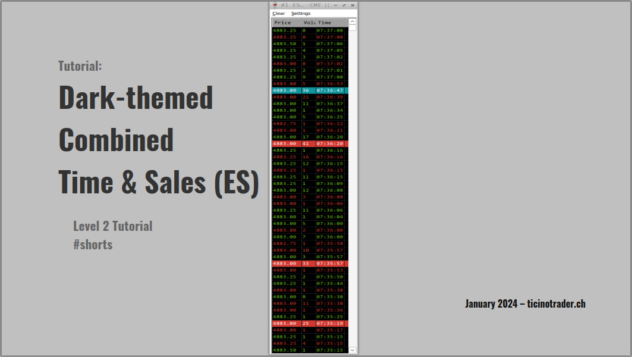
Below is the #short chartbook tutorial video for the Dark-theme Combined Time and Sales for ES post. Created with SierraChart v2586...
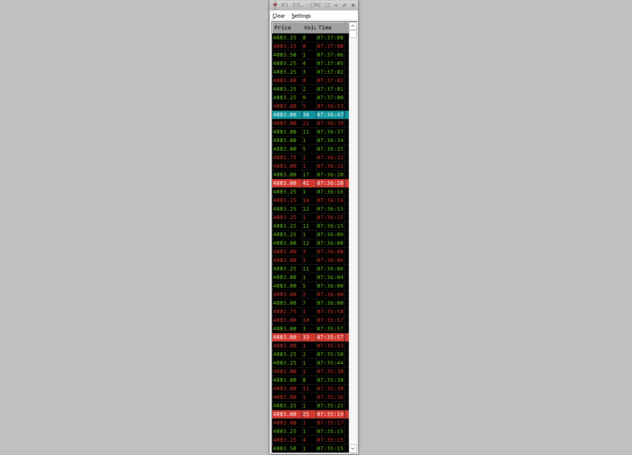
Simple dark color Time and Sales chartbook – created based on request. The T&S window displays combined records (Same Type...
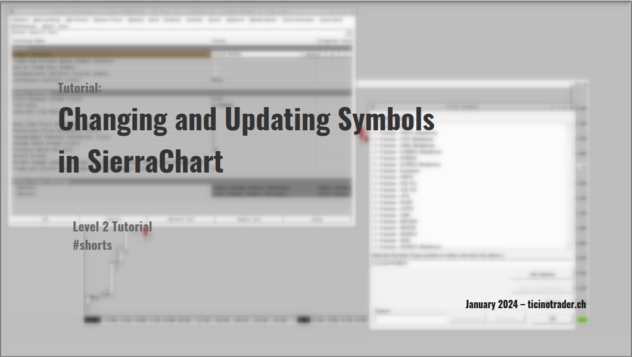
Below is the #short video for the How to (Automatically) Change Symbol Formats in SierraChart article post. Created with SierraChart v2571...

The following beginner’s guide may help to resolve the problem of a newly downloaded chartbook not displaying data because it...
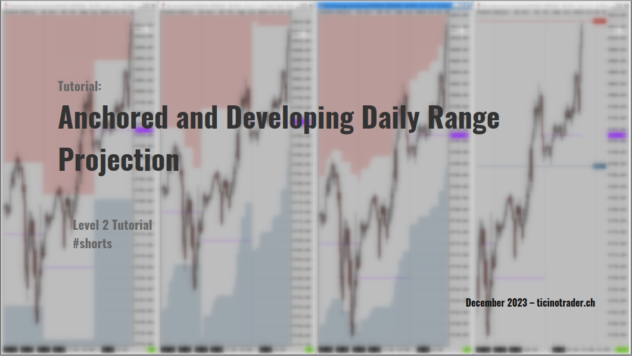
Below is the #short chartbook tutorial video for the Anchored and Developing Daily Range Projection post. Created with SierraChart v2571 | Link...
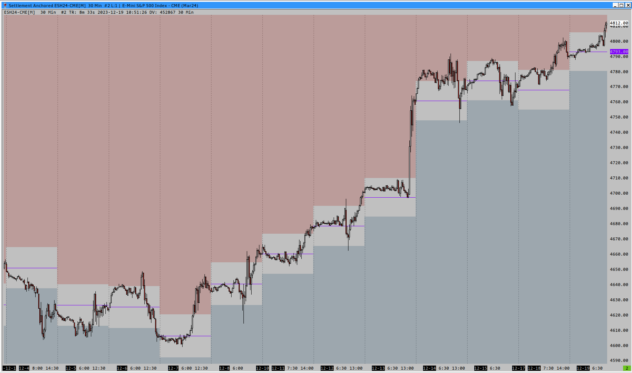
The attached chartbook request calculates the Standard Deviation of the daily Average True Range and based on the result creates...
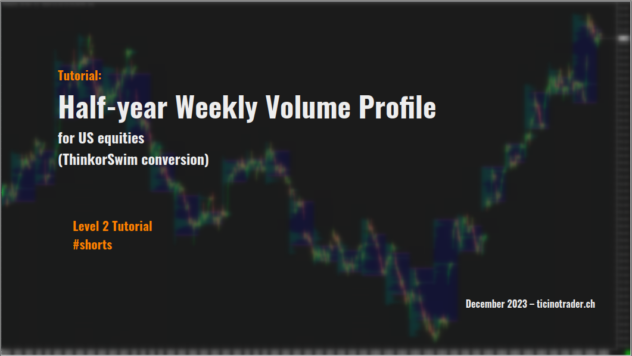
Below is the #short chartbook tutorial video for the Half-year Weekly Volume Profile for US Equities (ThinkorSwim conversion) post. Created with...
This chartbook request was created to replicate an existing ThinkorSwim layout. It displays a 180 days (half-year) chart with 30min...