How to Overlay Initial Balance on DOM in SierraChart
The free article below provides instructions about how to overlay the TPO Initial Balance Range on a Trade DOM in SierraChart. The original question was posted on the SierraChart Support Board here.
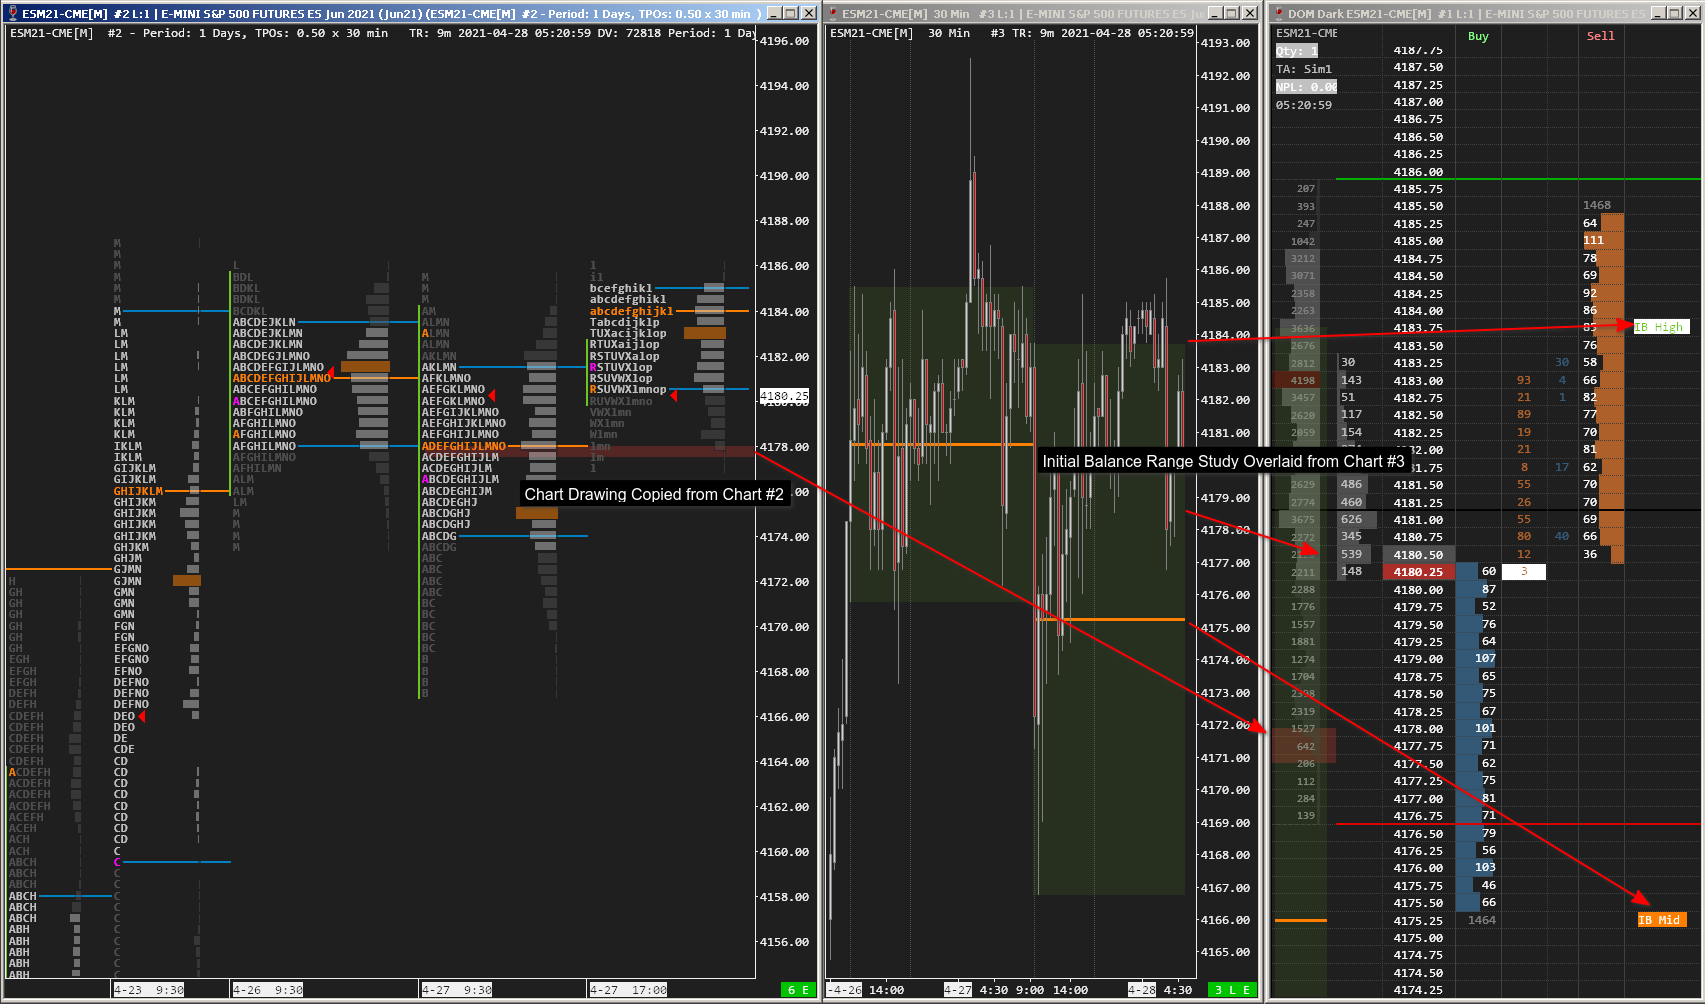
The chartbook demonstrates two options to overlay/display IBR related information on the DOM
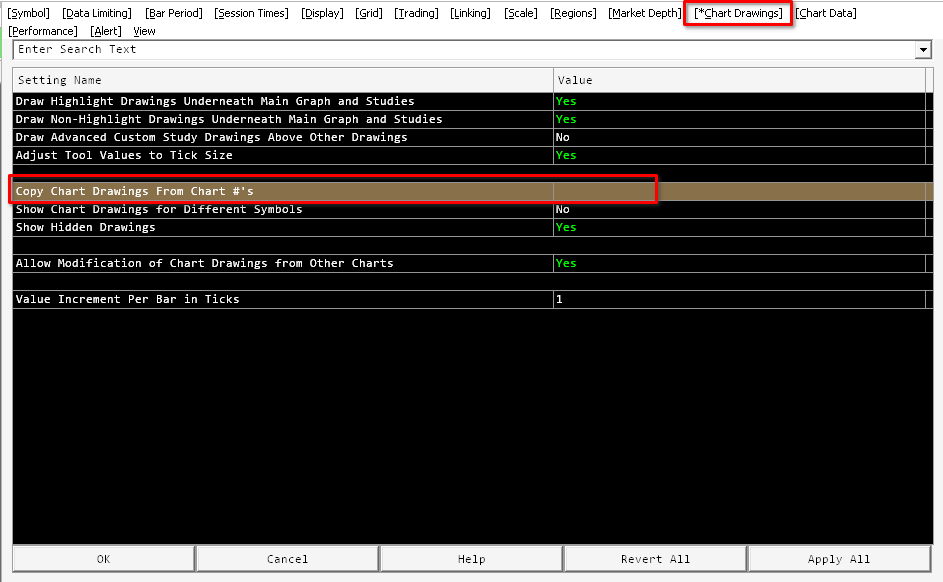
[1] Copy Chart Drawings from other chart to the DOM automatically
- Check the DOM’s Chart Settings >> Chart Drawings >> Copy Chart Drawings from Chart # option to overlay any drawing from other charts.
- This overlays the Drawing left to the price scale of the DOM.
- In this example, the TPO POC level of Chart #2 was highlighted and automatically copied to the DOM window.
- Click here to read the SierraChart documentation of this function.
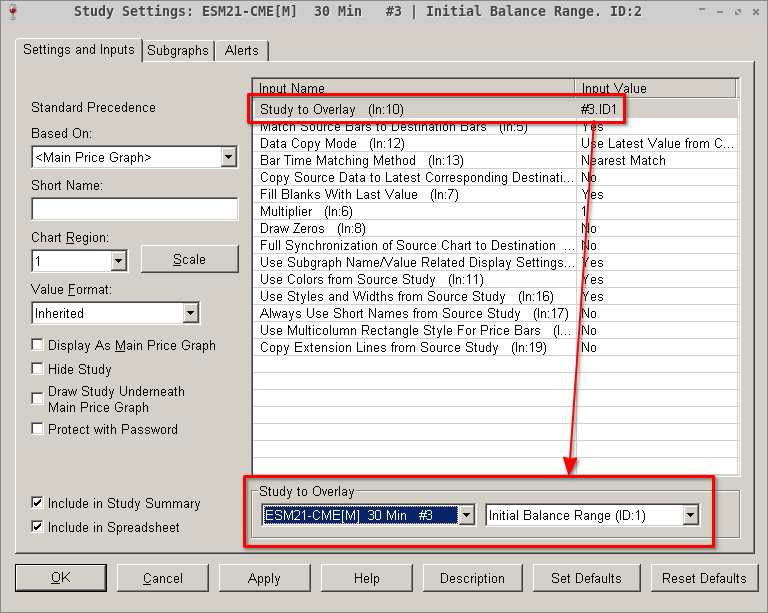
[2] Overlay Initial Balance Study from an external chart to the DOM
- Add the Initial Balance study to an external chart (in this example Chart #3) and overlay it to the DOM by adding the Study/Price Overlay study to the DOM.
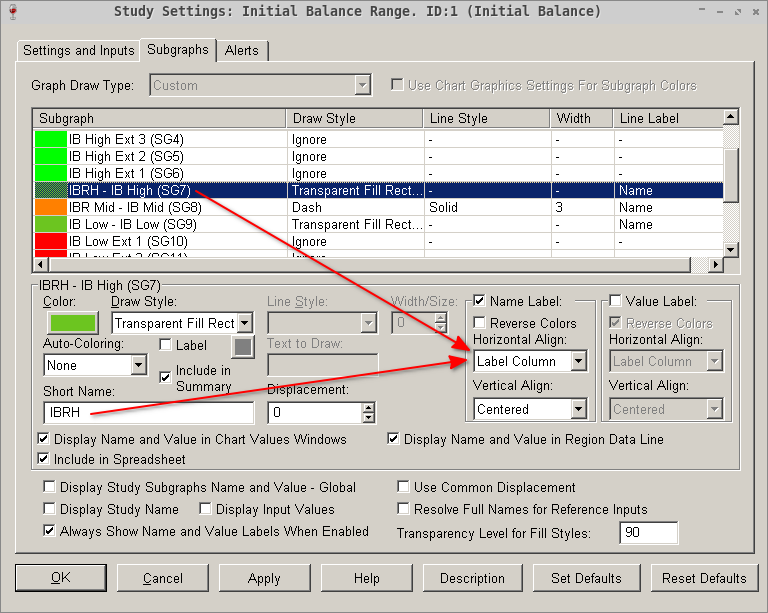
- Depending on the settings of the overlaid study, this can display drawings, [1] left to the Price scale (green highlighting), [2] value labels on the Price scale or [2] text/value labels in the ‘Label Column’ of the DOM, if displayed.
- In this example the IB High/Low is overlaid as a green highlighting and the Mid point as an orange line.
- Name Labels of the study are displayed in the Label Column at the left side of the DOM. You can turn the Label Column ON, at Trade – Customize Chart/Trade DOM Columns section.
- Label Column can be vertically positioned as you like, similar to other DOM columns.
- To adjust the graphics settings of the overlaid information (color, line type, etc), you need to modify the Study Subgraph Settings of the source chart’s (#3) IB study.
- Click here to read the SierraChart documentation of the Study/Price Overlay study.
Created with SierraChart v2363 | Link to Chartbook
For the best experience, it is recommended to have a direct license with SierraChart, because broker versions can have limitations!
MAKE SURE YOU UPDATE TO THE LATEST SIERRACHART (2363 OR ABOVE) BEFORE USING THIS CHARTBOOK! SIERRACHART ISSUED MANY NEW CHANGES REGARDING BUILT-IN STUDIES, CHARTBOOK FORMATS, ETC, THAT AFFECT THE LOOK AND FEEL OF CHARTBOOKS CREATED WITH NEW VERSIONS.
Copy the .cht file to your \SierraChart\Data\ folder.
Click here for instructions about using the chartbook with different symbols.
Last updated: January 7, 2024 at 22:41 pm
Uploads are powered by Proton Drive, MEGA, and Vultr.