Chartbooks for SimpleSystemTrading Volume Dots study
You can find below multiple chartbooks for the Volume Dots orderflow study created by Frederik @ SimpleSystemTrading.
The study helps to visualize buy/sell pressure and imbalance points on traditional charts (Candlestick, Footprint, etc).
Please click here to learn more about the Volume Dots study.
You should own a Volume Dots study license to use the chartbooks!
The below chartbooks are free for the SST Study license owners
Created with SierraChart v2363 | Link to Chartbooks:
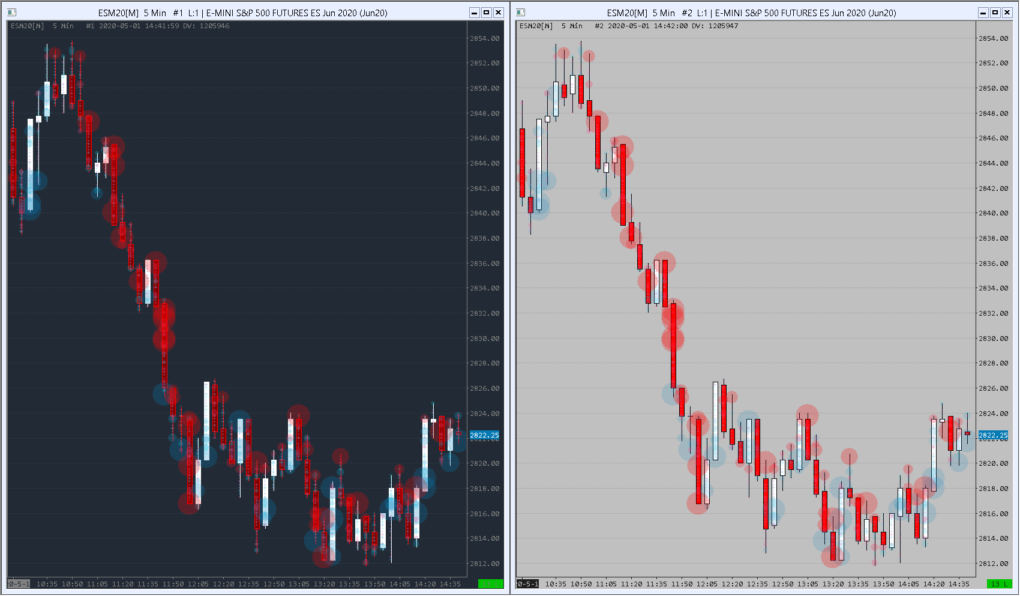
- Candle Bars with Volume Circles
- Candle Bars with Buy/Sell side pressure
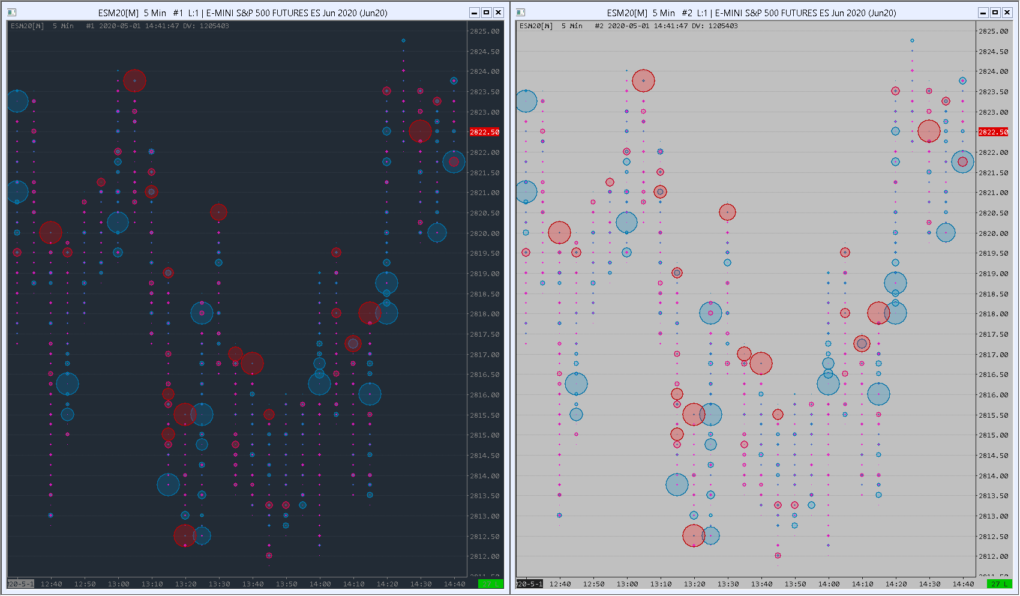
- Volume Dots ‘Chakra’ charts
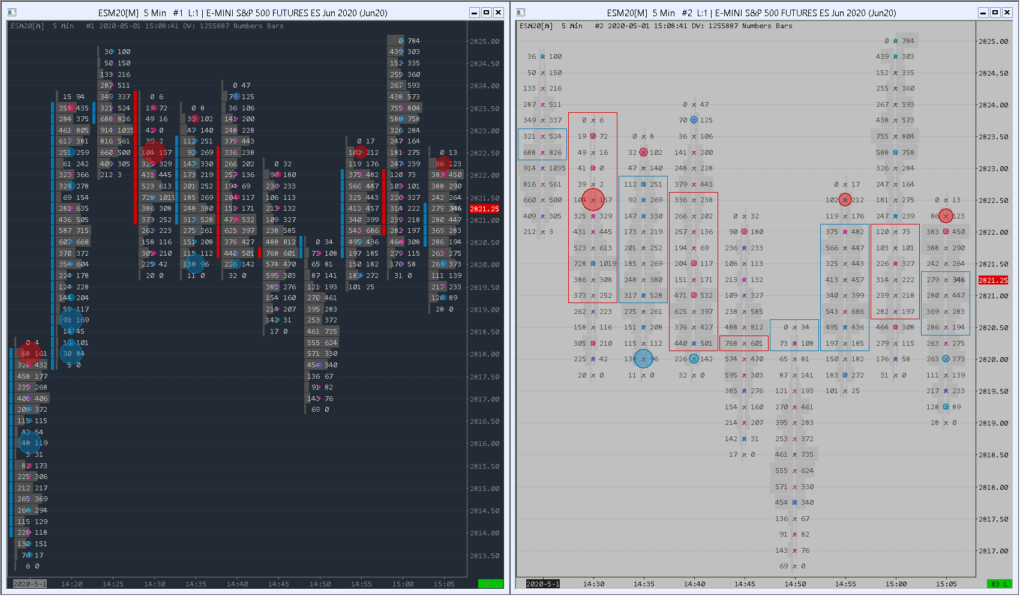
- Volume Dots ‘Chakra’ footprint chart
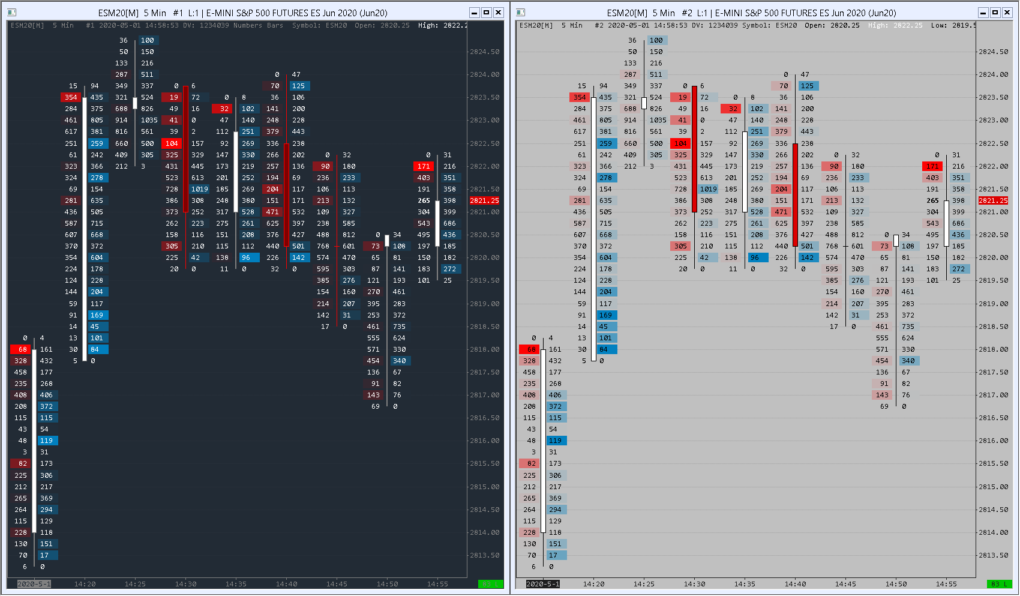
- Footprint Charts with Buy/Sell side pressure
For the best experience, it is recommended to have a direct license with SierraChart, because broker versions can have limitations!
MAKE SURE YOU UPDATE TO THE LATEST SIERRACHART (2363 OR ABOVE) BEFORE USING THIS CHARTBOOK! SIERRACHART ISSUED MANY NEW CHANGES REGARDING BUILT-IN STUDIES, CHARTBOOK FORMATS, ETC, THAT AFFECT THE LOOK AND FEEL OF CHARTBOOKS CREATED WITH NEW VERSIONS.
Copy the .cht file to your \SierraChart\Data\ folder.
Click here for instructions about using the chartbook with different symbols.
Last updated: January 3, 2024 at 10:59 am
Uploads are powered by Proton Drive, MEGA, and Vultr.