Overlay of Higher Timeframe Moving Averages
This chartbook request was created based on the previous Hourly HL Boxes layout and demonstrates how to add/display higher timeframe...
This chartbook request was created based on the previous Hourly HL Boxes layout and demonstrates how to add/display higher timeframe...
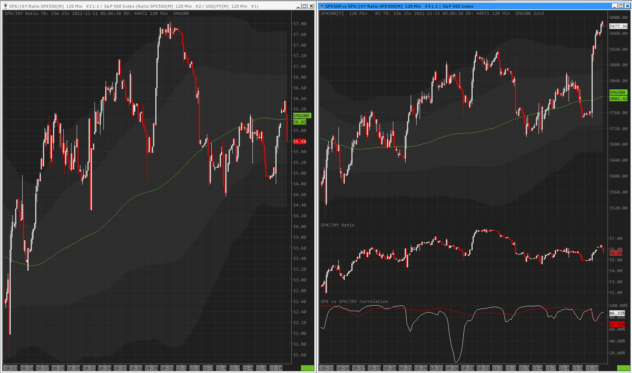
The attached chartbook request displays the relation (ratio) between the SP500 Index and the Japanese Yen Index. The original idea...
This short video is the first in the series of Monthly Reviews, where I give an overview of the Level...
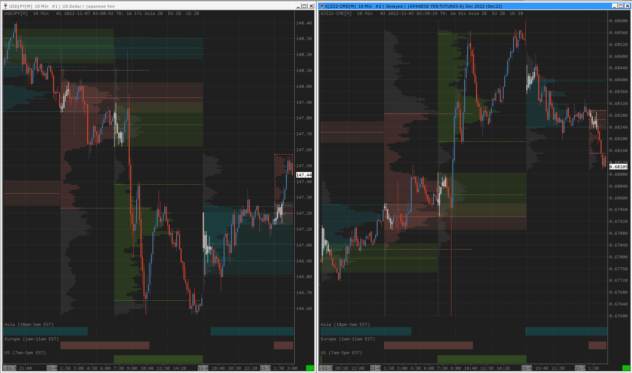
In this Forex chartbook, major worldwide (Asia/Europe/US) financial centers’ activity is highlighted The left chart in the layout is optimized...

This is a simple demonstration of how to display footprint values from the Numbers Bars Calculated Values study, as values...

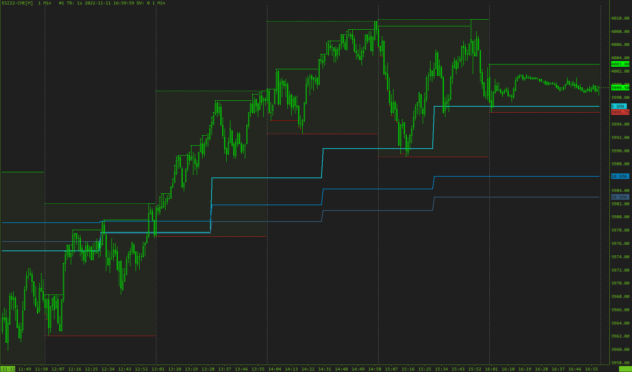
In this ES chartbook request, the higher intraday 1-hour timeframe’s High/Low values are displayed on a 1-minute chart. Three sets...
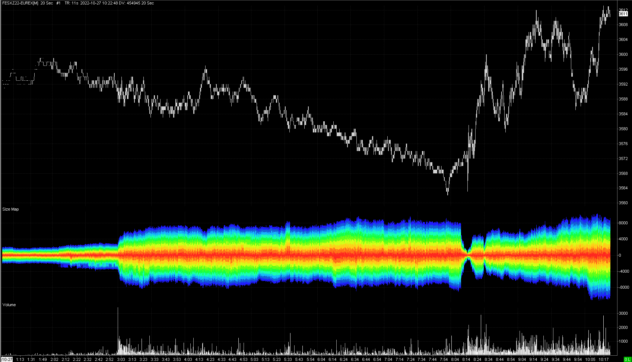
The attached chartbook shows the well-known ‘Nanex-style’ Size Map, which could help to visualize the change and distribution of liquidity...
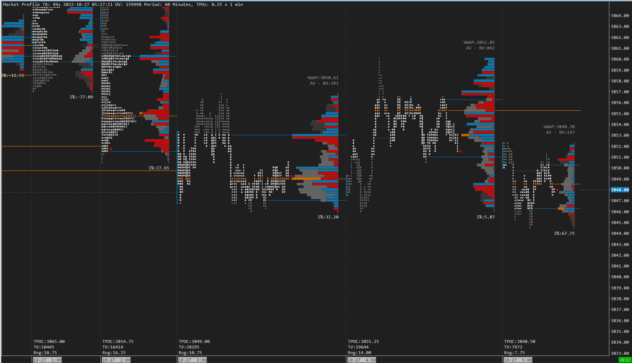
Traditional TPO Market Profile charts use 30 minutes based subperiods as a basis for calculating either the full session or...
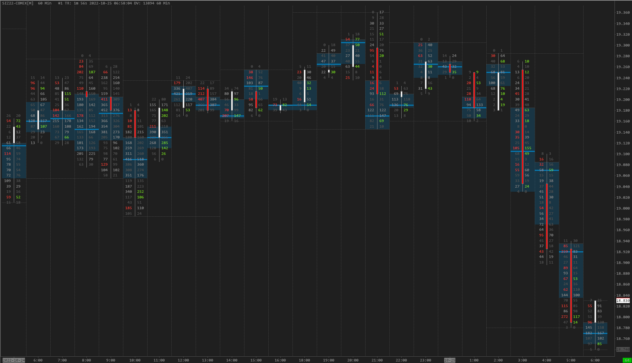
Silver futures Footprint chartbook with 60minute based TPO Value Area and POC highlighting. On a secondary 1min chart in the...
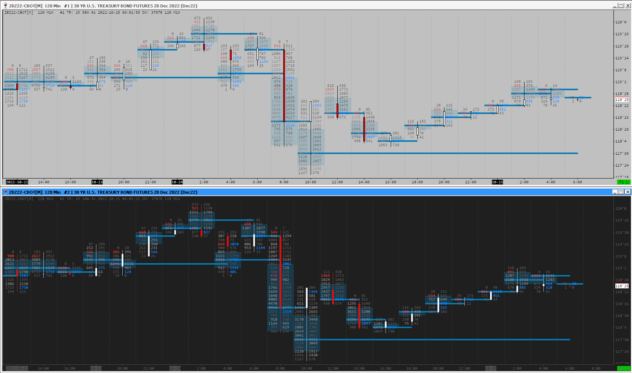
ZB footprint chartbook with Volume Value Area and POC highlighting of each bars. The layout uses a bar-based hidden Volume...